

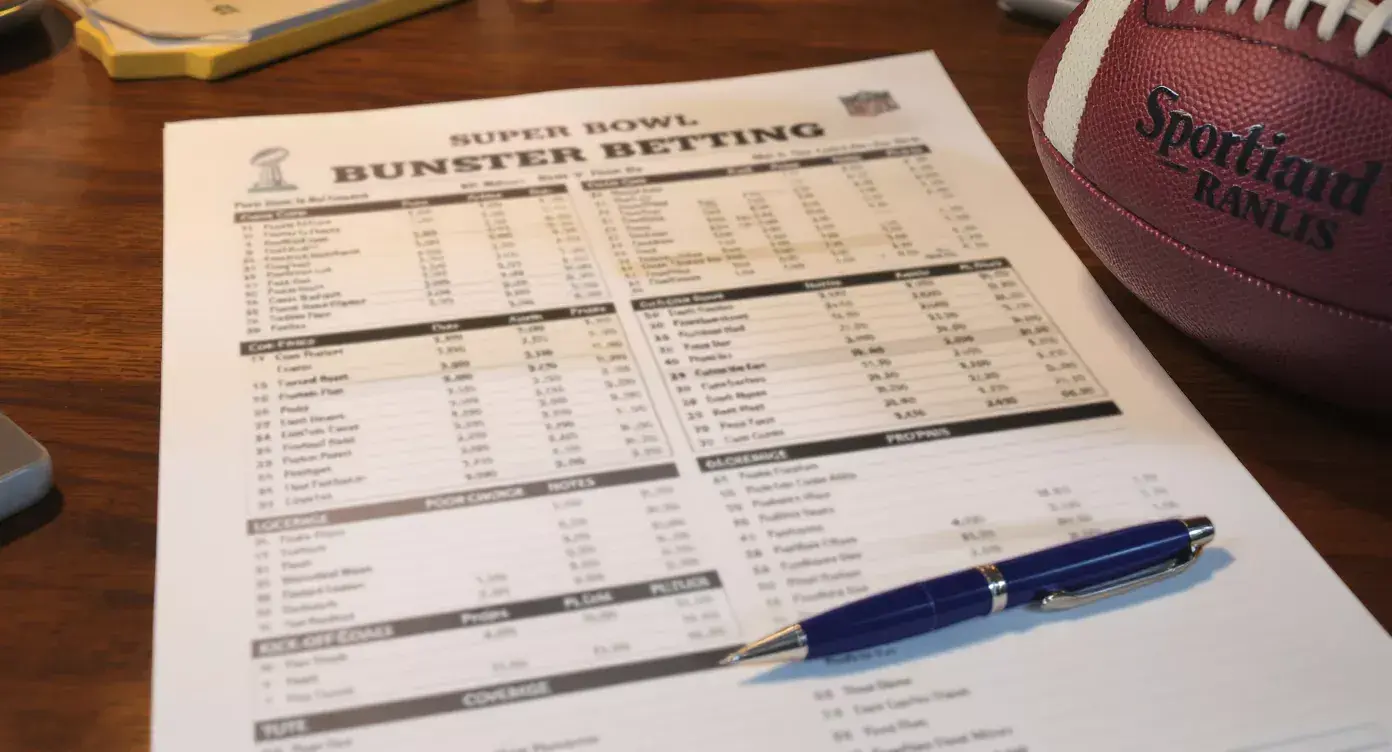
The week your weekly sheet stops being a weekly sheet
Open bet365 on Super Bowl Sunday morning and the NFL fixture loads with somewhere north of seven hundred markets attached to a single game. That is not a typo. The same single-page sheet that handles sixteen Sunday fixtures in November cannot accommodate the depth of pricing the Super Bowl produces. I learned this the hard way in 2021, when I tried to fit two hundred Super Bowl props onto the same template I had used for the previous seventeen weeks and ended up with a sheet that fell off the edge of A4. The Super Bowl needs its own template, and that template is a different beast entirely.
This piece keeps the focus tight on Super Bowl sheet design. Not the regular weekly sheet, not the playoff bracket sheet, not the rest of the NFL year. Just the big-game template – what makes it structurally different, how to lay out the core markets and the props block, how UK time-zone coverage interacts with the sheet design, and how to run the post-game tally. Bill Miller, AGA president, captured the scale of the event when he said “no single event brings fans together like the Super Bowl” – the betting volume reflects that, and the sheet has to absorb it.
What makes a Super Bowl sheet structurally different
The regular weekly sheet is a horizontal grid. Sixteen rows, one per fixture, with columns for spread, total, moneyline and a few notes. The data fits because each game gets four or five markets at most. The Super Bowl sheet is a vertical document, because one fixture takes the entire page – and the seven hundred-plus markets need vertical real estate the regular sheet was never designed to handle.
The shift from horizontal to vertical changes the workflow. On a weekly sheet you scan across, comparing the same column for sixteen different teams. On a Super Bowl sheet you scan down, working through markets for the same two teams. The mental model is different, and the layout has to match. I treat the Super Bowl sheet as a structured document with clearly separated blocks rather than a grid – top block for core markets, middle blocks for the various prop categories, bottom block for live in-play notes and post-game tally.
The depth of pricing also forces a triage decision. You will not bet every market. You may not even glance at most of them. The sheet design has to make it easy to skim past markets you do not care about and zoom into the ones you do. I use bold section headers and consistent column widths within each block, so the visual rhythm tells me where I am without needing to read every row.
One more structural difference matters for UK punters specifically. Sky Sports Super Bowl LVIII coverage peaked at 761,000 UK viewers – a 35 percent increase on the previous single-game record – and the UK audience builds on the night across multiple windows. The sheet has to support that drawn-out engagement, which means making the in-play sections easy to use during a 10pm UK kick-off and into the small hours of Monday morning.
The core markets block at the top of the page
The core markets block sits at the top of the Super Bowl sheet and contains the bets that drive most of the volume: spread, total, moneyline, halftime spread, halftime total, first-half moneyline, and the winning margin bands. Eight to ten rows, clearly labelled, with columns for the opening line, the line as of Sunday morning, and the closing line captured five minutes before kick-off.
I lay these out in a fixed order regardless of the fixture, because the brain pattern-matches faster when the layout is consistent. Spread always sits at the top of the block, total second, moneyline third, then the half-game variants. The winning margin bands – 1-6 points, 7-13 points, 14+ points – get their own row at the bottom of the block, because they price differently from the spread and need to be evaluated separately rather than alongside it.
Each row carries three line columns. Open, mid-week, close. The mid-week capture happens on Friday evening, which is the natural point in the Super Bowl betting cycle when public money starts to dominate and the line consolidates. The close happens five minutes before the 23:30 GMT kick-off – or whatever the actual kick-off time is for the year, since it shifts marginally depending on the Sunday in February. The three numbers let you see the movement arc through the week and identify whether your bet was booked at a sharp price.
Total comes second for a reason. Super Bowl totals carry a structural quirk: they tend to drift lower through the week as public money piles onto the under, then snap upward in the final hour as late-money flows hit the over. That intra-day swing is rarely visible on the regular weekly sheet because the timeline is compressed, but on the Super Bowl it becomes a real factor, and a punter who is going to bet the total needs to know when in the week the line gives them the best edge.
The props block and the categories that earn their space
The props block is where the Super Bowl sheet earns its size. Seven hundred markets break down into rough categories: player passing props, player rushing props, player receiving props, anytime-touchdown-scorer markets, team props, game-flow specials, coin-toss novelty, and same-game build-a-bet combinations. Not all of these deserve sheet space.
I track player props for the quarterbacks, the lead running backs, and the top three pass-catchers on each side. Twelve players, three props each on average – passing yards over/under for QBs, rushing yards over/under and anytime TD for RBs, receiving yards over/under and anytime TD for receivers. That is about 36 to 40 rows, which fits in a manageable middle block.
Team props occupy a smaller block – first to score, score in every quarter, longest TD over 49.5 yards, and the like. Maybe ten rows. Game-flow specials are mostly entertainment and I skip them entirely on the betting side, though I write them onto the sheet so I have a record of which ones the bookmakers offered, in case a pattern emerges over multiple Super Bowls.
The coin toss is on every Super Bowl sheet I have ever built, not because it is good value – at evens each way with vig, it is the worst-priced bet in the document – but because someone in the room will want to back heads or tails, and tracking it gives the sheet a complete record. The American Gaming Association estimated US$1.76 billion would be wagered legally on Super Bowl LX in U.S.-licensed sportsbooks, a 27 percent year-on-year increase, and a meaningful portion of that volume runs through novelty markets that exist mostly for entertainment value. The UK does not segment its data the same way, but the pattern is identical.
I keep a deeper section in my own working file for the underlying props mechanics – overround, market depth, settlement quirks – which I treat as a separate piece of work. Anyone who wants the full breakdown of how UK firms price NFL props can find it in my guide to NFL prop bets in the UK.
The UK time-zone block and the broadcast question
The Super Bowl kicks off at 23:30 GMT on the second Sunday of February in a typical year. That timing matters for sheet design because it shapes the punter’s evening rhythm. You are not betting between 18:00 and 23:30 the way you would on a regular Sunday slate – you are positioning before kick-off, then holding into the small hours, then watching the closing markets unfold past midnight UK time. The sheet has to support that arc.
The time-zone block carries three rows. First row, kick-off time confirmed in GMT, with a note for any year that runs an earlier window. Second row, broadcast schedule on Sky Sports and ITV with their respective start times – both broadcasters carry the game, and the prop ranges on Sky differ slightly from those promoted by ITV during the build-up. Third row, in-play market windows: when do live spreads open, when do halftime markets refresh, when does live cashout become available. These details are easy to forget at 02:00 UK time when you are five hours into the broadcast and trying to remember whether the second-half spread is even priceable yet.
I write a separate column on the sheet labelled “UK availability” for any market that does not pre-print across both Sky Bet and bet365. Some markets only appear on specific operators’ Super Bowl menus, and capturing that on the sheet means I do not waste ten minutes hunting for a price that does not exist where I am looking.
Walking back the results on Monday morning
The post-game tally is the last block on the sheet, and it is the one most punters skip. That is a mistake. Super Bowl betting is the single biggest information-rich event of the NFL year, and the tally is where you extract the lessons that carry into next season’s preparation.
I capture three things on Monday morning. First, the result of every bet I placed – won, lost, pushed, voided – with the final settlement amount. Second, the closing line on every market I tracked but did not bet, so I have a record of where the line ended even if I was not in the bet. Third, a few short notes on the patterns I noticed: which markets moved most through Sunday, which props were settled correctly versus disputed, which operators paid out fastest.
The third element is the one that compounds. After three or four Super Bowls of these notes, you start to see the structural patterns in how UK operators handle the event – which firms are aggressive on prop pricing, which are slow to settle, which run promotions worth taking advantage of. That kind of institutional knowledge is invisible if you only ever look at one Super Bowl in isolation, and it is the kind of thing that separates punters who improve year on year from punters who repeat the same mistakes.
