

ROI tells you what happened; CLV tells you what will
I spent two NFL seasons obsessing over ROI before I understood why it kept misleading me. Week 4, I was running plus 18 percent ROI through twelve bets and feeling clever. Week 14, the same picking discipline had me at plus 2 percent and questioning everything. Nothing about my process had changed; only the variance had. The metric that would have told me both weeks were performing identically – at the level of underlying skill – was closing line value, and I was not tracking it.
This piece stays narrow on CLV: what it is, how to record it on a weekly sheet, what thresholds matter, why the metric separates luck from skill more cleanly than ROI, and where it fails. We are not covering line movement in general, not tracking ROI as a primary metric, and not chasing the same-week shopping habit. The closing line, the final number, the difference between your booked price and that close – that is the lane.
The definition that takes ninety seconds to grasp
Closing line value is the difference between the price you booked on a bet and the price the same market closed at immediately before kick-off. Express it in spread points, percentage points of implied probability, or implied probability points – the format varies by punter, but the underlying idea is identical. If you bet Bengals minus two-and-a-half on Wednesday at 10/11, and the market closes Sunday at Bengals minus three at 10/11, you booked a half-point of value the market eventually agreed with. That is positive CLV.
The reason this matters is that the closing line is, on average, the sharpest assessment of the matchup the market produces. By the time kick-off arrives, every piece of public information has been priced in – injury reports, weather forecasts, sharp action, public action, late starting-QB changes. The closing line aggregates all of that into a single number, and decades of academic and industry analysis have shown that the closing line beats any individual handicapper’s prediction over a sufficiently long sample.
If you consistently beat the closing line, you are reading the matchup better than the market on average. That is the entire skill of NFL spread betting compressed into a single metric. The break-even win rate at standard minus 110 odds is 52.38 percent – and a punter who consistently produces positive CLV will, eventually, beat that bar. The “eventually” is the part that takes patience to accept.
The column you add to your weekly sheet
Recording CLV requires two timestamped prices on the same bet: the price you actually took, and the price the same market closed at. The mechanics are simple, but the discipline of capturing both numbers on every bet takes a season to make automatic.
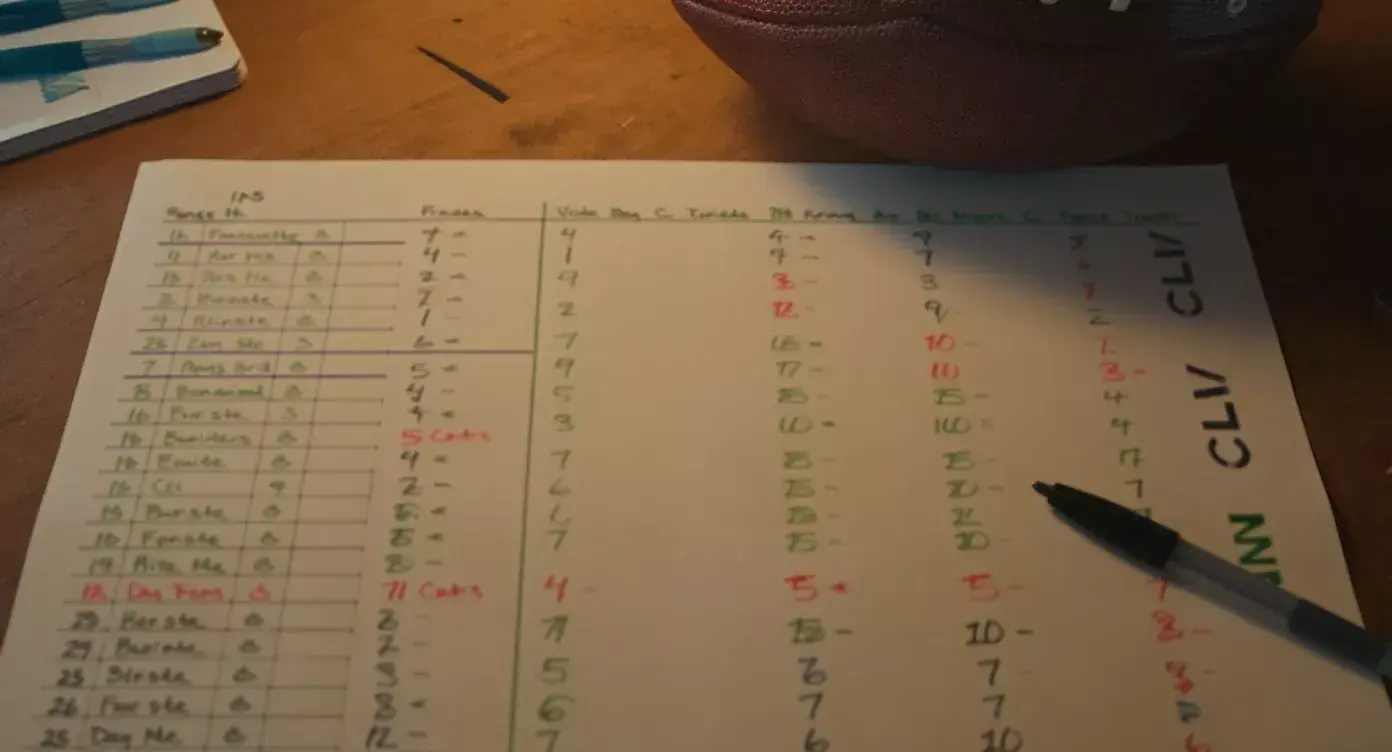
My weekly sheet has a CLV column that I fill in after kick-off, not before. The column records the closing spread in one cell and the implied probability gap in the adjacent cell. So if I booked Bengals minus two-and-a-half at 10/11 and the close was Bengals minus three at 10/11, the column reads “+0.5 spread / +1.9 percent CLV.” The percentage is calculated by converting both spreads to their implied win probabilities and taking the difference.
Spread CLV in points is easier to read at a glance – half-points and full points feel intuitive to anyone who has bet NFL for a season – but percentage CLV is more comparable across different price levels. A half-point of CLV on a spread that crossed both three and seven is statistically more valuable than a half-point that crossed neither key number, and the percentage format captures that nuance. I record both because they answer slightly different questions about the bet.
The closing line itself you capture from one of the major UK operators five minutes before kick-off, ideally the same operator you booked with. Cross-operator CLV – comparing your booked price at bookmaker A to the close at bookmaker B – is statistically valid but introduces noise from operator-specific pricing differences. Keep it clean by using the same source for the close as for the original booking, at least until you have a season of data and want to compare.
What positive, neutral and negative CLV actually mean
Punters new to CLV often want a target – what number do I aim for, what is good, what is bad. The honest answer is that any consistent positive CLV is good, and the higher the better, but absolute thresholds depend on the markets you play and the operators you use.
For NFL spread bettors at UKGC-licensed firms, a sustained CLV above plus 1.5 percent average across all bets is genuinely strong. That number sounds small until you remember that the vig at standard 10/11 each way is 4.76 percent, so a punter generating 1.5 percent CLV is clearing roughly a third of the bookmaker’s margin every bet. Across a season of two hundred bets, that compounds into a meaningful edge over break-even.
CLV between plus 0.5 percent and plus 1.5 percent is a positive signal but not necessarily a winning signal – variance can still drag a positive-CLV punter into negative ROI over a single season, particularly across the high-variance world of NFL spreads. CLV around zero suggests the punter is reading the market roughly as well as the market reads itself, which over time produces returns close to break-even minus vig. Sustained negative CLV – below minus 0.5 percent – is a warning sign. The punter is consistently booking prices the market subsequently sharpens against them, and over time that pattern translates to losses regardless of any single week’s ROI.
The thresholds shift slightly for moneyline and totals markets, which carry different vig structures and different sharp-money dynamics, but the broad logic holds. Positive is good. More positive is better. Consistency matters more than peak.
The variance-versus-skill problem CLV solves
Here is the part that took me too long to understand. ROI and CLV measure different things, and the gap between them is the entire variance problem in NFL betting.
ROI measures outcomes. You won or lost the bet, the stake came back as a return, and the percentage tells you the bottom line. The trouble with ROI is that NFL spread betting carries massive variance over short samples – a hundred bets is small, two hundred is medium, and even five hundred bets leaves room for a skilled punter to be running below break-even on pure ROI through pure bad luck. The Betvisors framing is sobering on this point: sharp bettors typically wager on 20 to 30 percent of available games, focusing only on spots where they identify genuine edges, and a 55 percent win rate is excellent and profitable at minus 110 odds. Note: excellent and profitable, not effortlessly winning. The maths is unforgiving even for skilled players.
CLV measures process. Did you book a price the market subsequently agreed was sharp? That question is answerable bet by bet, and it does not depend on whether the specific game went your way. A punter who books positive CLV on every bet for a season but loses fourteen coin flips in a row is having a bad-luck season, not a bad-skill season. The CLV column tells them that. The ROI column does not.
UK online real-event GGY grew 7 percent year-on-year in Q4 2024-25 to £1.45 billion, partly because operators are increasingly sharp at sorting their customer base by CLV signal. A punter who consistently produces positive CLV will, eventually, attract attention from a bookmaker’s risk team – which is a separate problem worth a separate discussion. For now, the practical point is that CLV is the metric the trading desk watches, and if it is the metric your bookmaker watches, it should be the metric you watch too. The full mechanics of integrating CLV into a weekly tracker fit naturally into a templated sheet – my printable NFL weekly sheet template walks through where the CLV column sits relative to ROI and the rest of the tracker.
The traps that catch punters using CLV badly
CLV is not a magic metric. It can be measured incorrectly, interpreted optimistically, or used as a substitute for actual results discipline. A few traps catch most punters who pick up the metric without thinking through how it can mislead.
The first trap is comparing prices across different bookmakers without normalising for operator-level differences. A booked price at a recreational firm versus a closing price at a sharp firm produces a number that looks like positive CLV but really just reflects the gap between operator margins. If you want clean CLV, use the same operator for booking and close, or at minimum use a sharp consensus closing line that you trust to represent the true market.
The second trap is treating CLV as a guarantee of long-run profit. CLV is the strongest single indicator of underlying skill, but it is not the only factor. Bet sizing, bankroll management, market access and pricing efficiency all matter. A punter with positive CLV but reckless staking can lose money over a season even though their picks were directionally correct.
The third trap is sample size. Sixty bets is not enough to draw conclusions about CLV trends; two hundred is the rough minimum where CLV averages become statistically meaningful, and a full season of three hundred to four hundred bets is where the signal genuinely settles. Punters who declare themselves “positive CLV punters” after a hot fifteen-bet stretch are kidding themselves, and the next thirty bets often reset the picture. Patience is the discipline that makes CLV useful.
